@MeghanMHall
now a
vintage
sticker!
this 2015
MacBook
Air is why I
learned R
you can
use R for your entire
data analysis workflow!
you don’t have to
use R for your entire
data analysis workflow!
Struggles
Struggles
do as much in R as possible
focus on what’s realistic, not ideal
Struggles
do as much in R as possible
focus on what’s realistic, not ideal
- can’t access data through R
Struggles
do as much in R as possible
focus on what’s realistic, not ideal
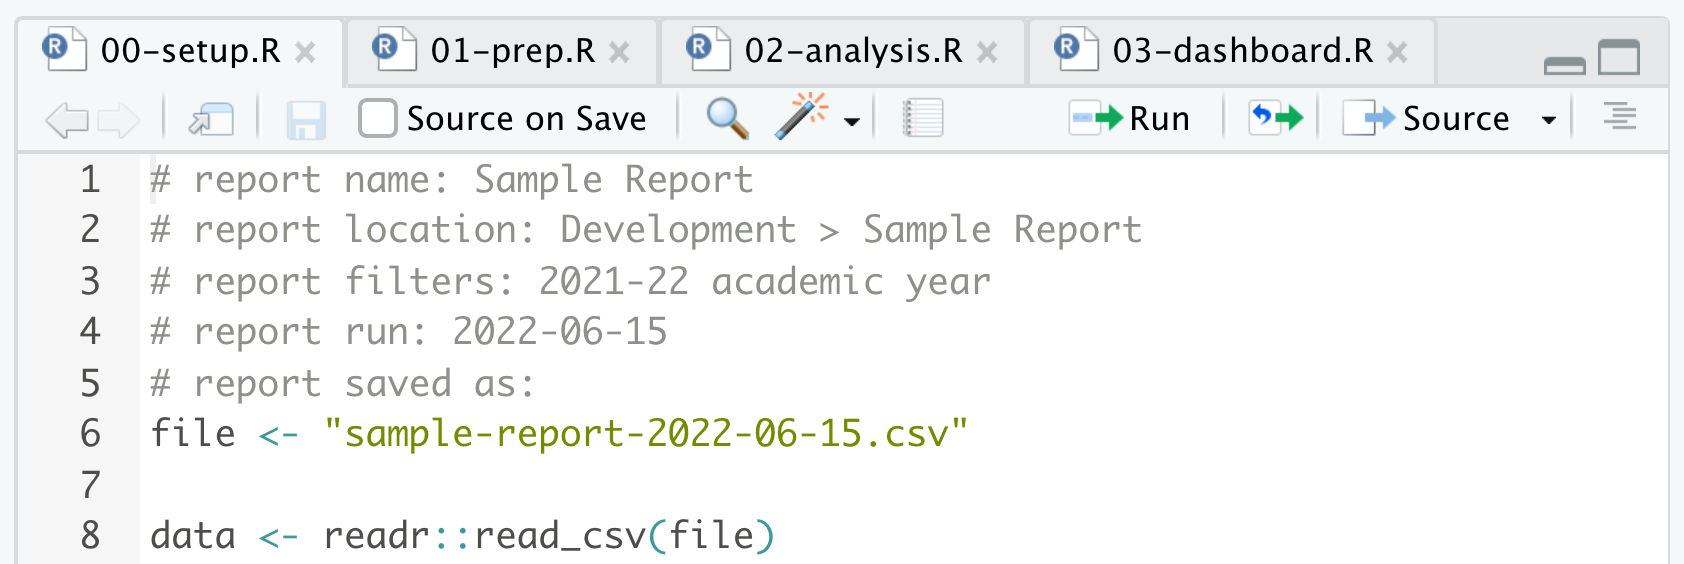
00-setup.R
01-prep.R
02-analysis.R
03-dashboard.R
Struggles
do as much in R as possible
focus on what’s realistic, not ideal
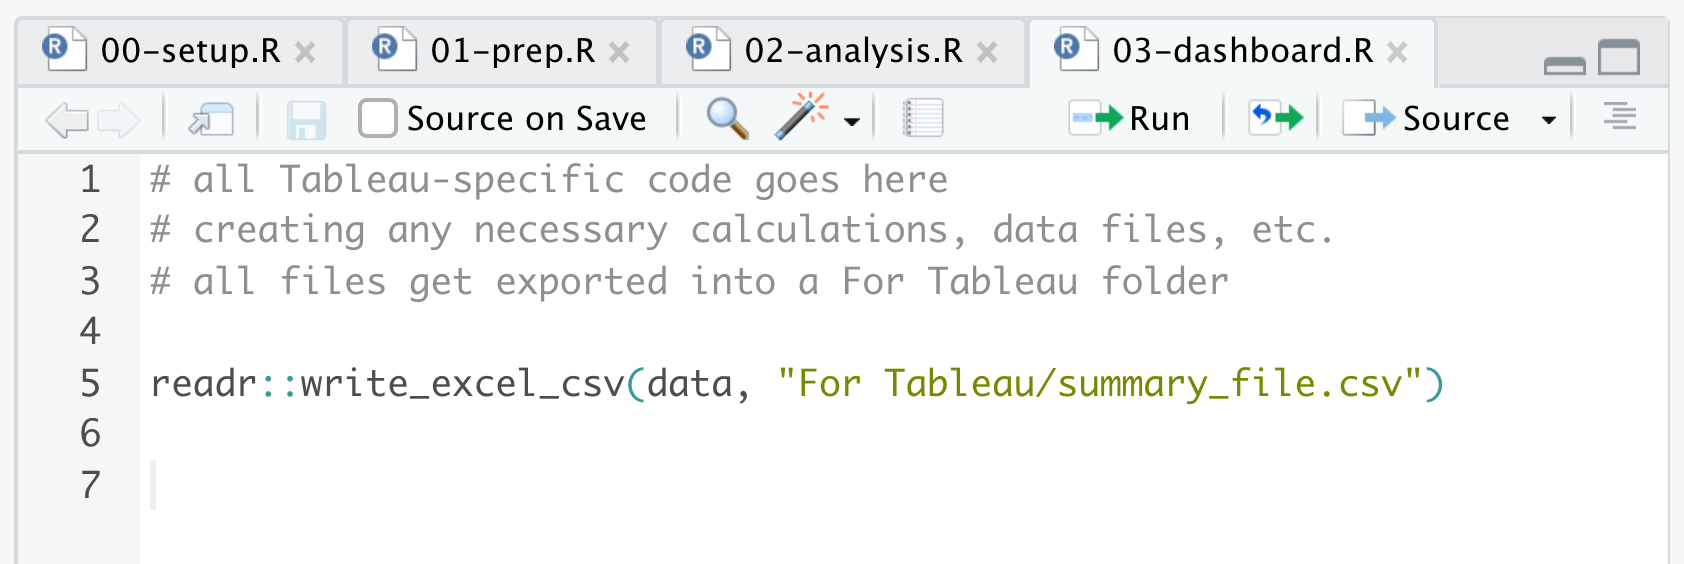
00-setup.R
01-prep.R
02-analysis.R
03-dashboard.R
- document all report decisions: name, location, filters, run date, effective date
- save data prep work for R
Struggles
Struggles
do as much in R as possible
focus on what’s realistic, not ideal
- can’t access data through R
- need to dashboard elsewhere
Struggles
do as much in R as possible
focus on what’s realistic, not ideal
00-setup.R
01-prep.R
02-analysis.R
03-dashboard.R
- handle relational data, aggregations, calculations, etc. in R
- save all data files in a specific folder
Struggles
Struggles
do as much in R as possible
focus on what’s realistic, not ideal
- can’t access data through R
- need to dashboard elsewhere
- no git/version control
Struggles
do as much in R as possible
focus on what’s realistic, not ideal
00-setup.R
01-prep.R
02-analysis.R
03-dashboard.R
- collaborate with yourself: use dated comments for major decisions
- link to supporting documentation
Struggles
do as much in R as possible
focus on what’s realistic, not ideal
00-setup.R
01-prep.R
02-analysis.R
03-dashboard.R
- collaborate with yourself: use dated comments for major decisions
- link to supporting documentation
Big Wins
Big Wins
ease the burden of repeated reporting
transfer institutional knowledge
Big Wins
ease the burden of repeated reporting
transfer institutional knowledge
- develop internal packages
- have easy access to common data sets used across multiple projects
- document data definitions and calculations
- track common analysis functions (and ggplot themes!)
Big Wins
Big Wins
ease the burden of repeated reporting
transfer institutional knowledge
- develop internal packages
- leverage parameterized reporting with R Markdown/Quarto
- many output formats!
- useful when you have code + text + updating data + varying parameters
Big Wins
less time reproducing
your own analysis
=
more time for the
work you find important
Thank you!
MEGHAN HALL
@MeghanMHall
meghall06
meghan.rbind.io
meghanhall6 AT gmail
slides made with Quarto 🎉